
Exploring Zone Strength using NHL Edge and On-Ice xG%
Jean-Gabriel Pageau is truly an inspiration to us all

The inspiration for this entire post comes from probably one of the most random places - but isn’t that how ideas work? I love Jean-Gabriel Pageau, he’s a legend around Ottawa, and I was curious to see how he’s been playing. I ended up looking up his expected goals data on MoneyPuck, and to my shock he’s sitting at a 38% on-ice xG%. “That can’t be right" was my honest reaction, I know he’s better than 38% on-ice xG%. I went on to check out his zone data on NHL Edge - which tracks time spent in each zone for individual players - and he spent a lot of time in the defensive zone compared to most players. This made sense to me, because everyone in Ottawa knew him as a great defensive forward, so the Islanders must have been using him a lot in the defensive zone, resulting in his on-ice xG% being as low as it is.
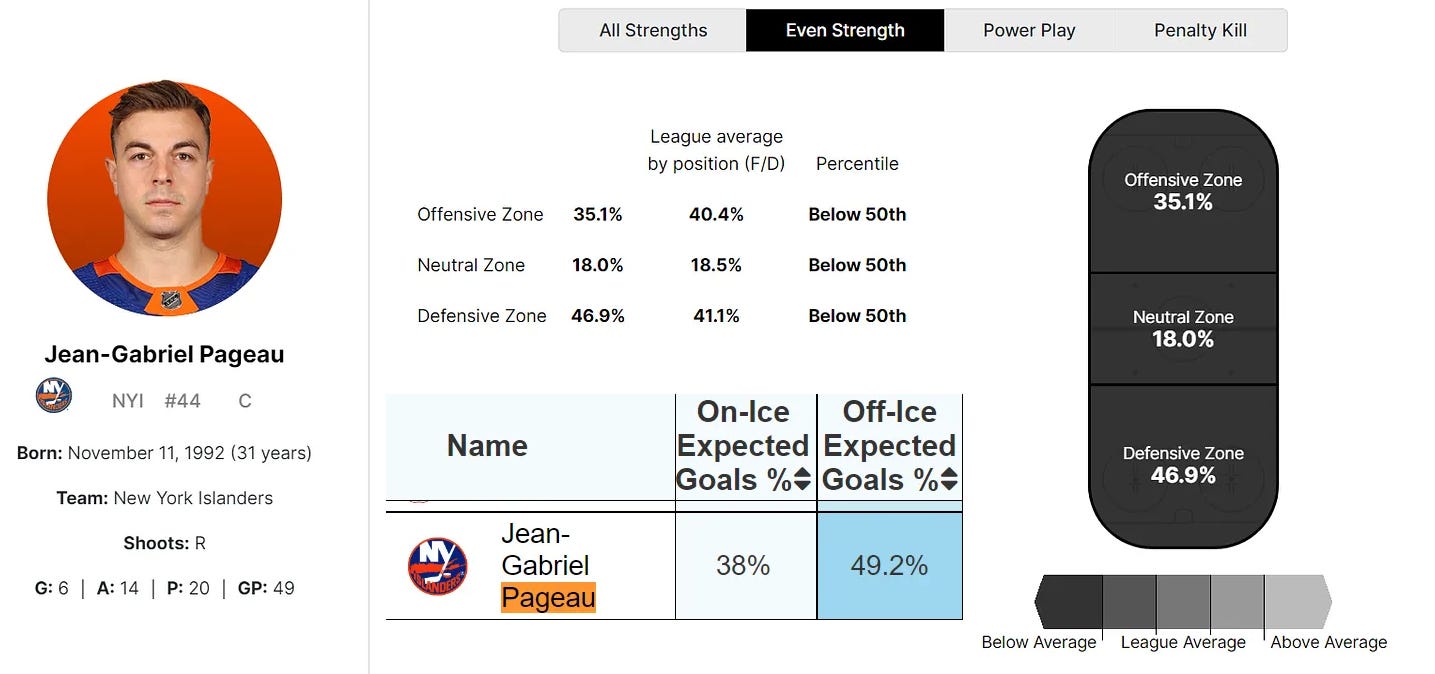
This lead me to wondering if I could use zone data from NHL Edge correlated with On-Ice xG data for each player, to analyze how effective NHL players are during their time spent in the Offensive Zone and Defensive Zone.
By gathering all on-ice shot events for all players with > 200 minutes played, I calculated each players xGF and xGA . With NHL Edge’s zone time data, players on-ice xGF and xGA, and ice time data through the season, I then calculate a players “On-Ice xG[F/A] per 10 Minutes in [Zone]” as
It’s a long name for the stat - so I’m just gonna call them “XGF/10OZ” and “XGA/10DZ” for the rest of this substack post.
I focused specifically on even strength data, as powerplay and penalty kill data would significantly impact zone strength data for players who play in penalty killing and/or powerplay roles, thus potentially misrepresenting the data.
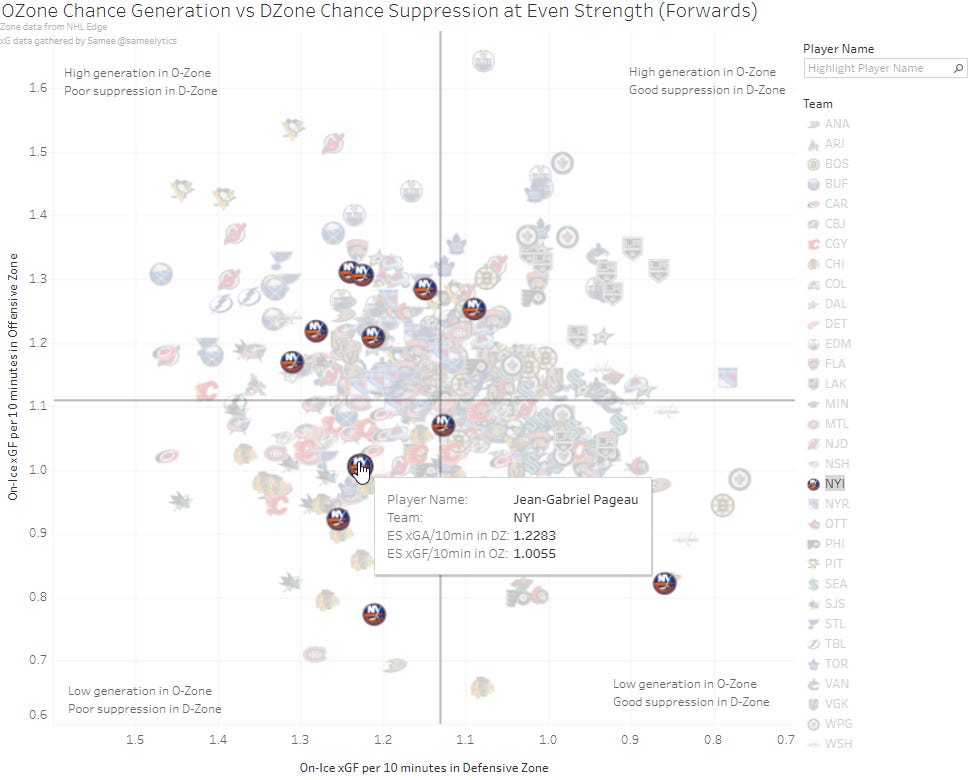
The next step was visualizing the data I had, as I wanted to make observations on players XGF/10OZ and XGA/10DZ values, relative to the amount of ice time they were receiving in each zone. I plotted them as such, where the y-axis would be the Even Strength XGF/10OZ or XGA/10DZ, and the x-axis represented Even Strength Offensive/Defensive Zone Time %. I also plotted players XGF/10OZ against their XGA/10DZ, to visualize players ability in chance suppression and chance generation in their perspective zones.
O-Zone Chance Generation vs D-Zone Chance Suppression
(XGF/10OZ vs XGA/10DZ)
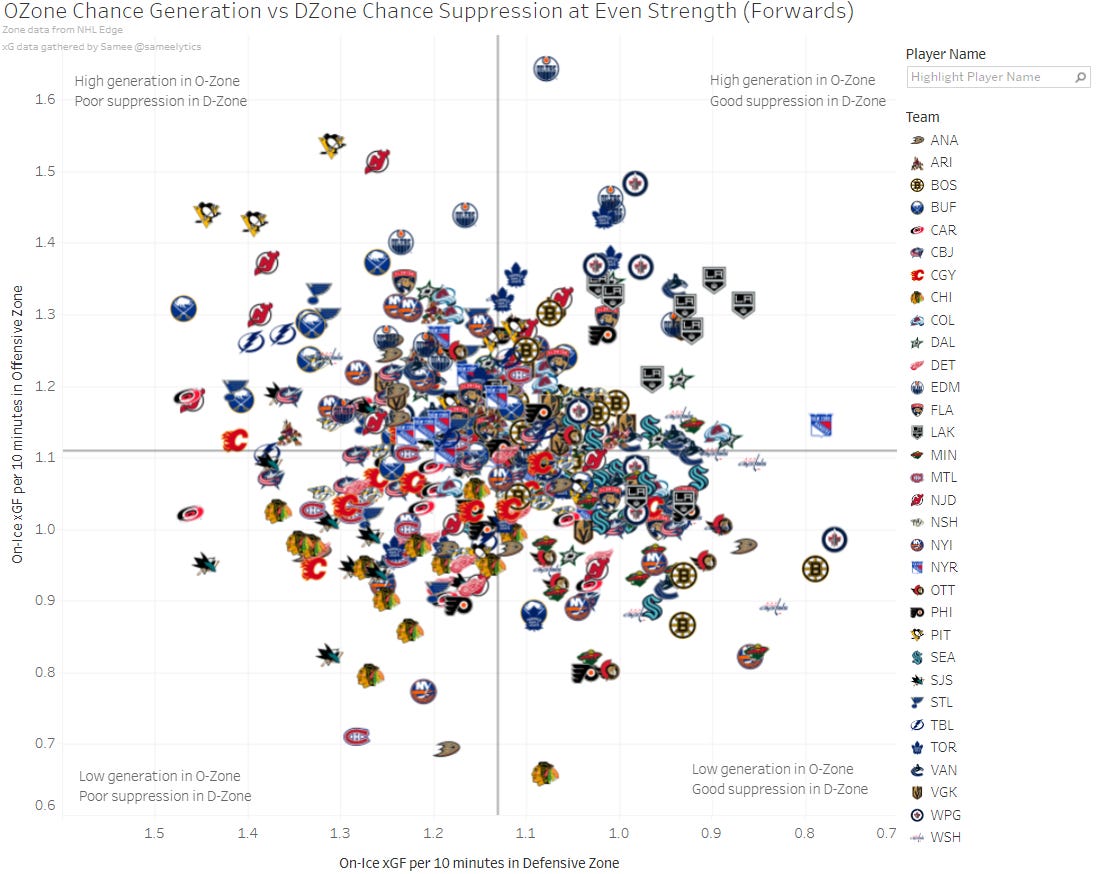
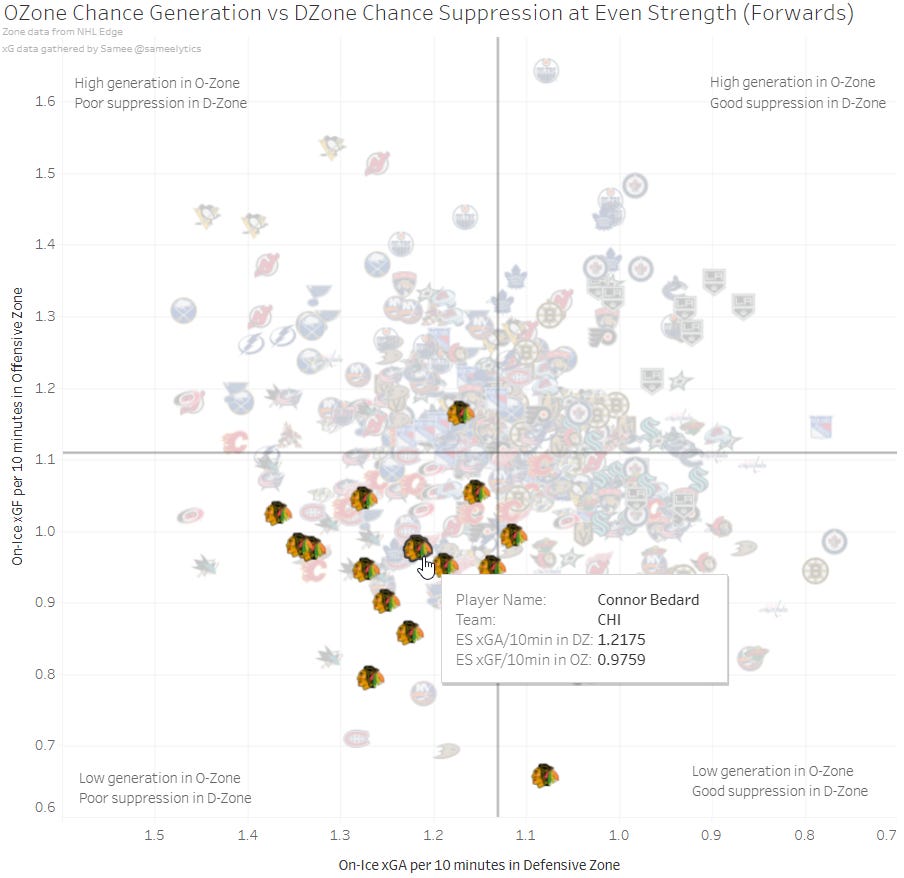
Each corner of the plot represents a players ability. The higher a player is in the plot, the better they are at generating chances during their offensive zone possessions, and the more right a player is, the better they are at suppressive chances when the other team is in possession.
First quadrant (top right) - great in chance generation, great in shot suppression.
Second quadrant (top left) - great in chance generation, poor in shot suppression.
Third quadrant (bottom left) - poor in chance generation, poor in shot suppression.
Fourth quadrant (bottom right) - poor in chance generation, great in shot suppression.
O-Zone Chance Generation at Even Strength vs O-Zone Time
(XGF/10OZ vs OZ Time %)
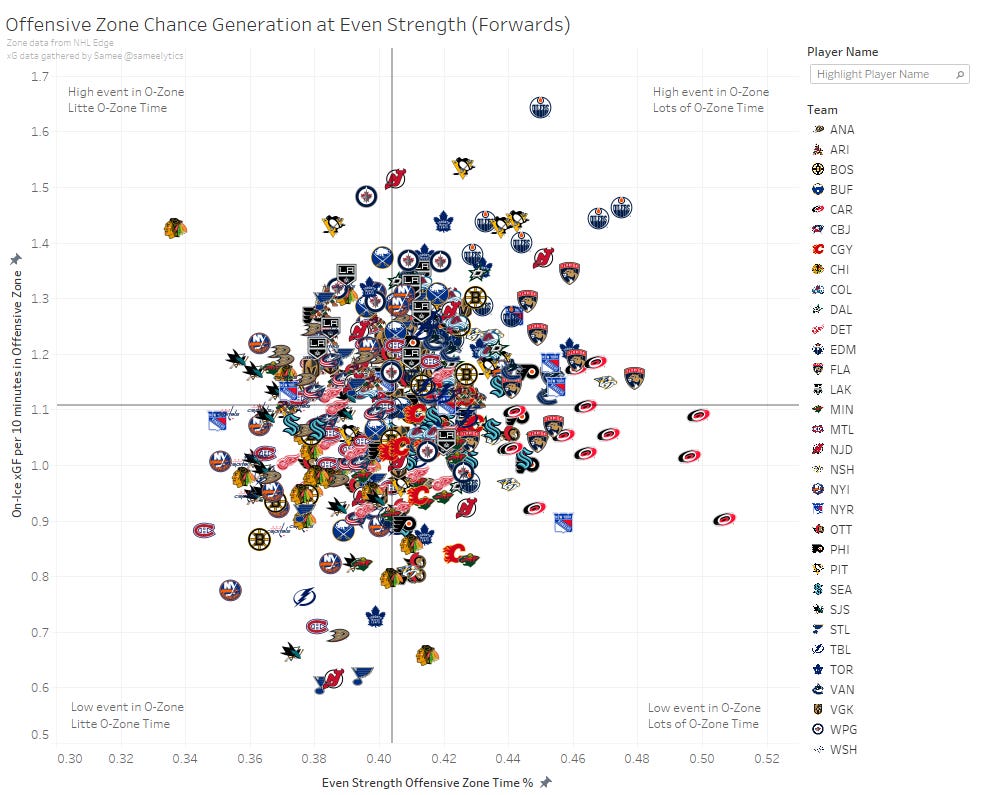
First quadrant (top right) - players who spend a lot of their shift in the Offensive Zone, and have a high XGF/10OZ, thus effective offensive zone possessions
Second quadrant (top left) - players who don’t spend a lot of their shift in the Offensive Zone, but make the most out of their time in the offensive zone having high XGF/10OZ.
Third quadrant (bottom left) - players who don’t spend a lot of their shift in the Offensive Zone, and not much happens when they are in the Offensive Zone.
Fourth quadrant (bottom right) - players who spend a lot of their shift in the Offensive Zone, but not much happens when they are in the Offensive Zone.
So, for example, Nico Hischier sits between quadrant one and quadrant two, and has a high XGF/10OZ, thus he is a high event player who spends an average amount of time in the offensive zone. Jesper Fast is deep in quadrant four, spending lots of time in the offensive zone compared to most players, but he does not generates a less than average number of xGF/10 Minutes in the offensive zone.
D-Zone Chance Suppression at Even Strength vs D-Zone Time
(XGA/10DZ vs DZ Time %)
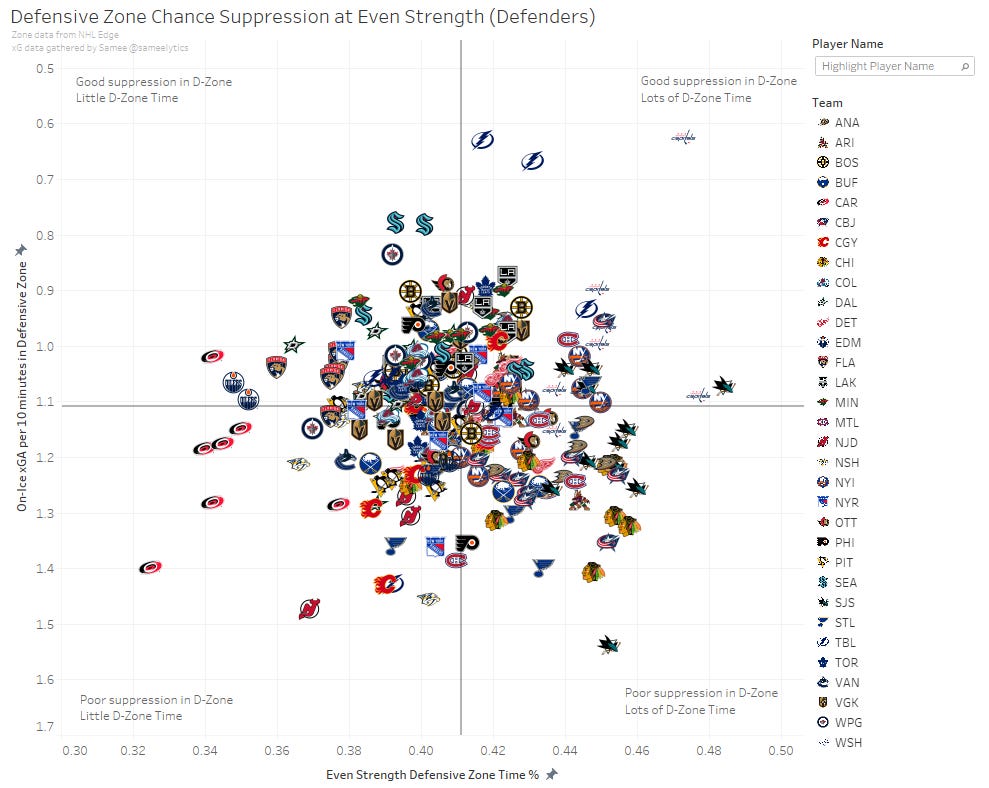
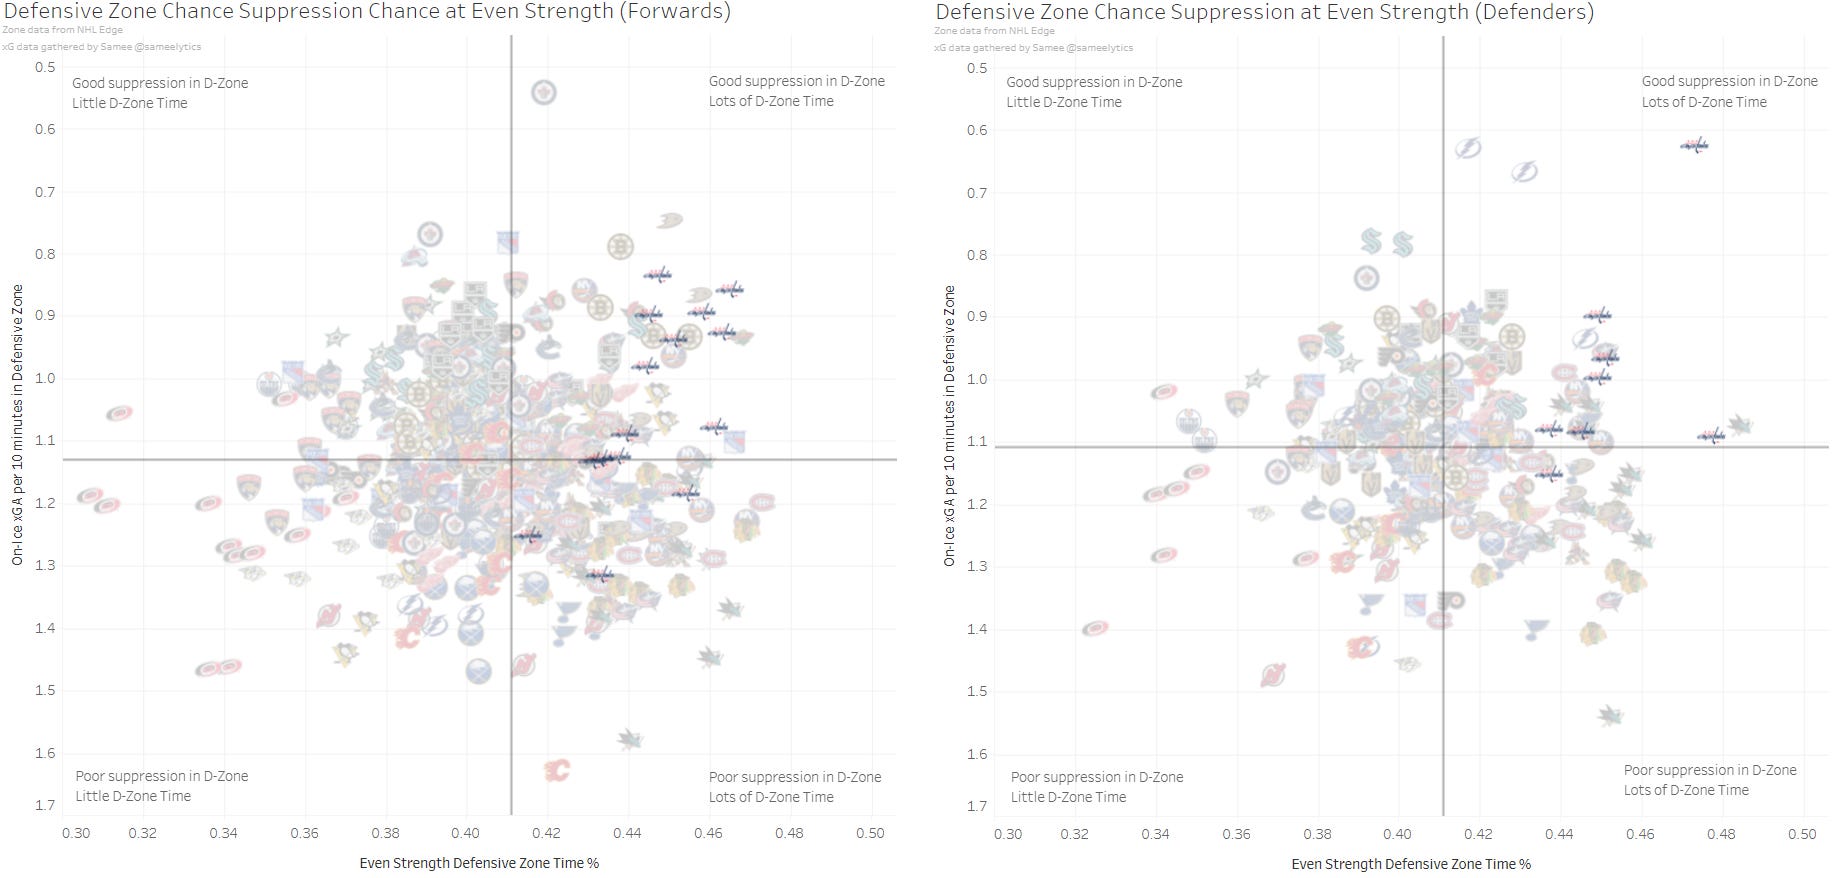
Defensive suppression charts function similar to the offensive zone charts, separated into four different quadrants.
The first quadrant (top right) would represent players who spend a lot of their shift in the Defensive Zone, and have a low XGA/10DZ, thus effective effective in suppressing chances against in the defensive zone.
The second quadrant (top left) would represent players who don’t spend a lot of their shift in the Defensive Zone, but are effective in the defensive zone with a low XGA/10DZ.
The third quadrant (bottom left) would represent players who don’t spend a lot of their shift in the Defensive Zone, and are poor with chance suppression when they are in the D-Zone, a high XGA/10DZ.
The fourth quadrant (bottom right) would represent players who spend a lot of their shift in the Defensive Zone, and are poor in chance suppression with a high XGA/10DZ.
Just as an example for a player analysis on this plot, Brent Burns sits deep in the third quadrant, as he doesn’t spend a lot of time in the defensive zone, but when he is there his chance suppression is poor and teams are more likely to score on offensive zone possessions against Brent Burns.
First glance observations
There are a lot of stories that these plots can tell, both for players and teams. I found its very important to consider how players perform relative to their team on these plots, as judging players alone in comparison to all players can mislead. Connor Bedard sits in the third quadrant, but relative to his team, which all sit in the third quadrant, he performs quite well.
The Carolina Hurricanes stand out as one of the weirdest teams in the model. They love having puck possession, as their players make up of the players with lots of O-Zone time, but are inefficient with the puck generating a low XGF/10DZ. They are also poor in suppressing chances against, but don’t spend much time in the DZone. This suggests that the Canes deploy a system where they are very patient with the puck.
The plot also stands as a testament to how well the Washington Capitals play in their own end. Compared to other teams, the Capitals spend lots of time in their own end, but despite this, most their players sit in the top right quadrant of both Defensive Chance Suppression charts.
Another player I wanted to look into was Juraj Slafkovsky, a player who has gotten lots of criticism for not living up to his first overall potential from some fans, but lots of praise from other fans for his play this season. So which is it?
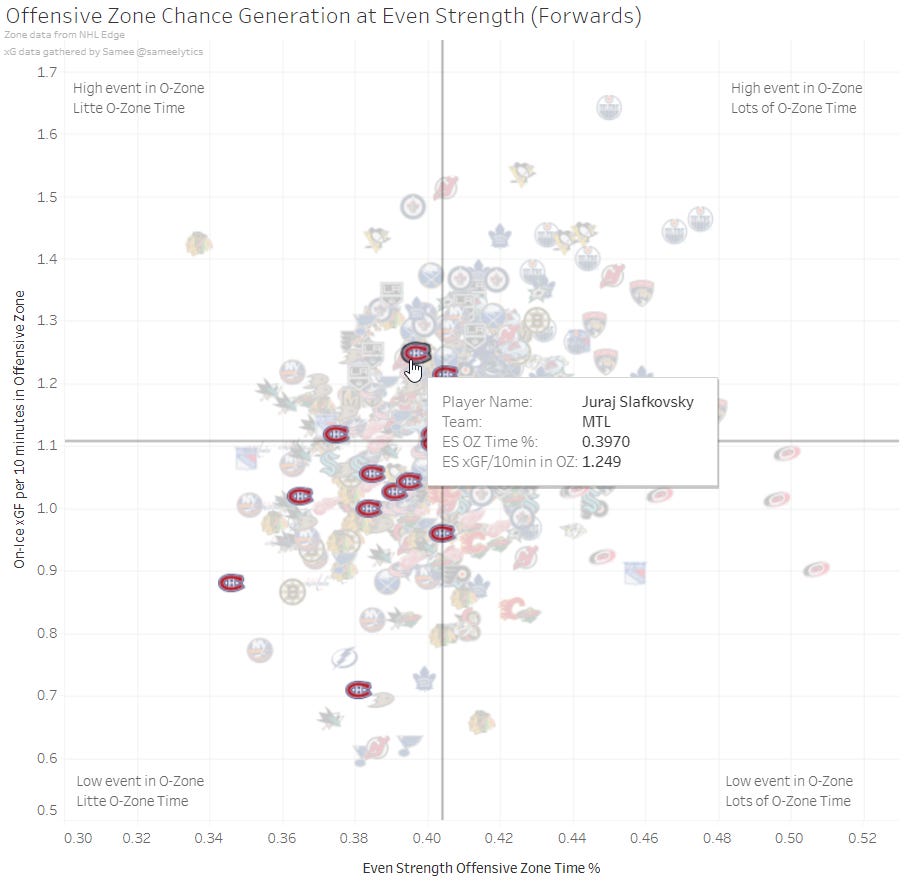
Slafkovsky stands on top compared to his teammates in offensive zone efficiency, generating the highest XGF/10DZ on the Canadiens. He doesn’t spend enough time in the offensive zone compared to Canadiens stars Caufield and and Suzuki, which is a reasonable explanation for why is output (20 points in 49 games). Once Slafkovsky is able to maintain more offensive zone time, I’m certain he’ll come into his own.
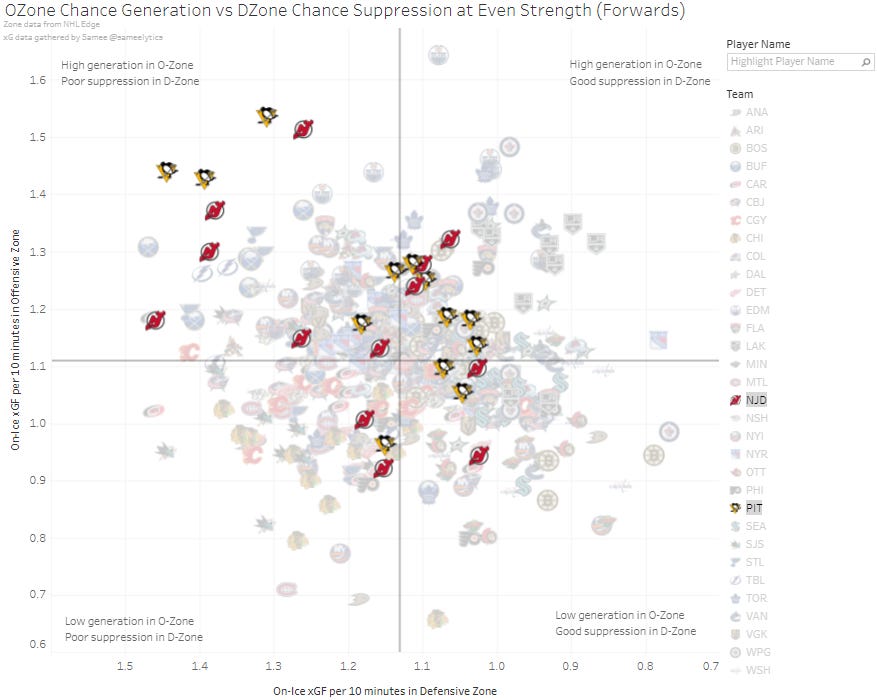
The Penguins top line (Guentzel-Crosby-Rust) appear as significant outliers when plotting XGF/10DZ against XGA/10DZ. The three sit in the top left of the plot, suggesting they sacrifice their defense for great offense - matching lots fans and pundits analysis of the Penguins top line. New Jersey’s top line players (Toffoli-Hischier-Bratt) display a similar behavior to the Penguins top line.
Finally, Jean- Pageau, the man who inspired me to do all this. Turns out his defensive zone suppression isn’t great anyway - but given how much time he spends in the defensive zone, maybe there’s more to the story (which perhaps I will explore in future posts! - so SUBSCRIBE!!!)
That’s just the tip of the ice berg of what these plots can tell you about players and teams in the NHL. If you want to checkout the data for yourself, here’s a link to the Tableau! And let me know what you find :)
Thanks for reading!
Samee
For the coding and data science enthusiasts out there, I’m planning to (hopefully) post a more in depth substack post on how I collected the data needed for this in the near future.